Take a sad chart and make it better
Files
To follow along with these chart redesigns, download this Excel file:
Here’s a finished version with the shiny new charts:
Source for the survey data: North American (Canada, Mexico, and the United States) results from the 2009 Programme of International Student Assessment (PISA), provided by the OECD.
Source for the test score data: my head; adapted from tutorial by Stephanie Evergreen.
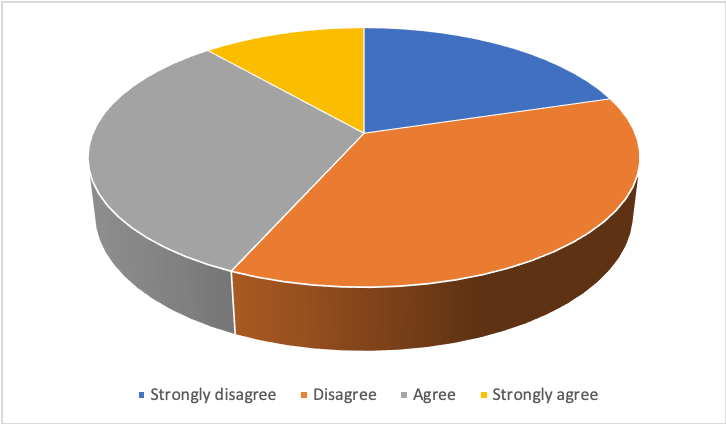
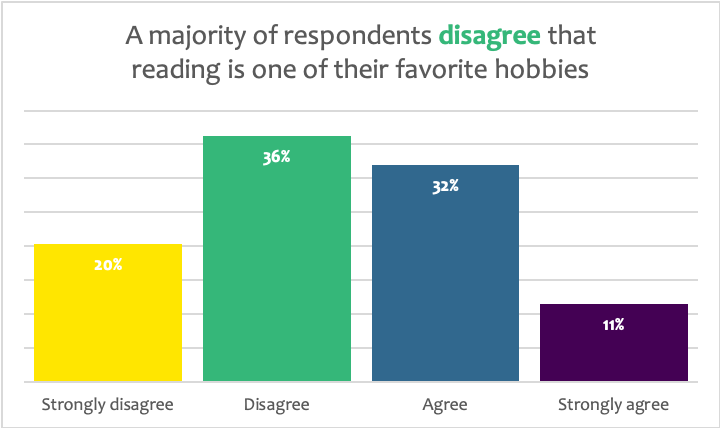
Pie chart to bar chart
Before
After
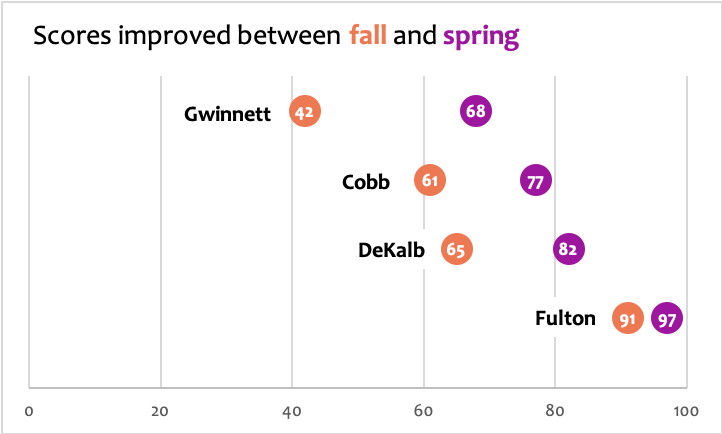
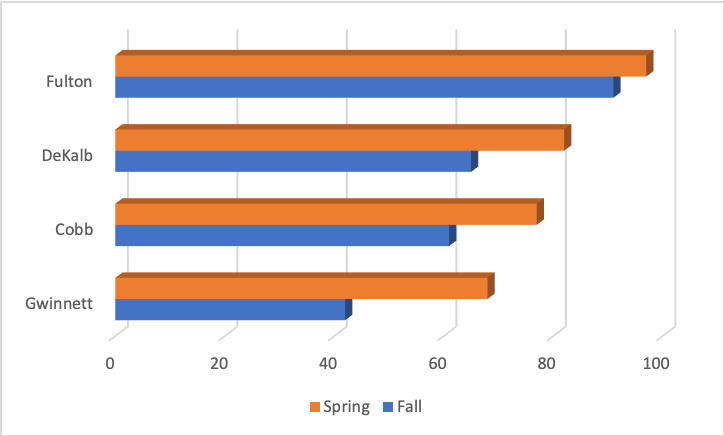
Bar chart to dot plot
Before
After